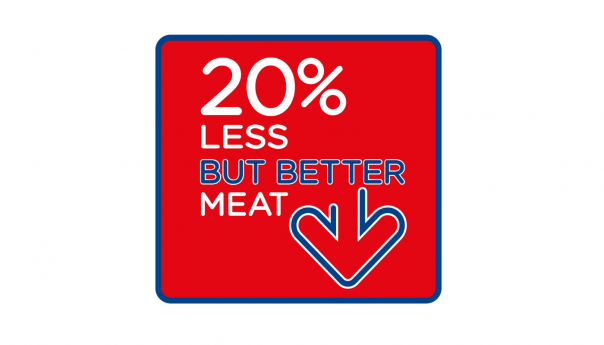
The PSC 100 Group campaign encouraging public sector caterers to reduce their ruminant meat consumption and use the savings to buy better quality UK sourced produce has been a big talking point in 2020.
This webinar will look at the purpose behind the campaign and arguments from all sides. The need to reduce our carbon footprints and to reduce obesity levels in the UK is clear. The methods to do this are multiple, however they need to be balanced with the need to support the UK economy and the UK farming and food producing communities.
By reducing ruminant meat consumption by 20% across the public sector the industry will contribute significantly to the objectives of carbon reduction and a healthier diet. The reduction will also free up budget to purchase better quality UK sourced meat products that will also contribute towards a lower carbon footprint and increased local social value.
The progamme for the webinar:
- Welcome - David Foad, Group editor, Public Sector Catering
- Intro to campaign - Andy Jones, Chair , PSC100 Group
- Sustainability in Public Sector Catering - Angela Tregear/Adam Wilkinson, Strength 2 Food
- Reducing meat consumption - the benefits - Simon Billing, CEO, Eating Better Alliance
- The benefits of ruminant meat and supporting the UK farmer - Stuart Roberts, Deputy President, NFU
- Q&A - Chaired by David Foad
Responses from Angela Tregear and Adam Wilkinson, Strength 2 Food to questions which were unanswered during the webinar due to time:
Do the carbon emmissions differ per farming system? Is the red meat emissions calculation worked out using global or UK meat?
AT: In the research, the emissions factors we used for meat distinguish between UK, continental European, and Rest of World origins. We studied procurement invoice data and interviewed suppliers to establish the origins of the different meats supplied to the case schools, and then applied the relevant emissions factors to make our calculations.
AW: These are asking similar questions and the answer to them both is that currently the tool does look at the carbon data at a national level rather than use global emissions. Angela made this point in response to a comment from Stuart. We do not however differentiate between production systems. This is very much a possibility in the future if the tool can be further developed, and there is no intrinsic reason why this should not be possible. However it would need the information on production to be available to caterers and to be so in a reliable form. If this was not the case then there is a danger that the caterer response would decline in accuracy even though the system is capable of greater sophistication. This is always the balance to be found in work of this kind. In the end it depends on having a clarity of purpose for the tool. So it might be possible/better to show what the average uk value was and then what the outcome may be if sourced from different production methods.
Webinars Diary
Featured webinars