
With the climate change agenda ever more pressing, catering organisations are increasingly looking to reduce their carbon footprints. But what are the carbon emissions of an average meal in a catering service, which activities contribute the greatest burden, and what should managers focus on most to reduce their footprint?
These were the questions investigated by a team of researchers within the European Union funded project ‘Strength2Food’. Led by the University of Edinburgh, and comprising partners in Croatia, Greece, Italy and Serbia, the team examined case studies of ten primary school meals services across five European countries, analysing which foods each service procured, how far the foods travelled, the levels of plate waste, and the waste disposal methods.
Within the ten cases, the team chose services that had a 'local' focus (marked ‘LOC’ on the graph) - where procurement involved a proportion of food sourced from suppliers within the local area - as well as services without that focus (marked ‘LOW’ on the graph. In fact, procurement laws meant the two Italian cases comprised a 'local-organic' service and an 'organic' one, so they are labelled ‘LOC-Org’ and ‘Org’.
The researchers were interested to see if the local services had lower carbon footprints than those without that emphasis. The results are shown in Figure 1, where a paired bar chart is given for each of the ten case services.
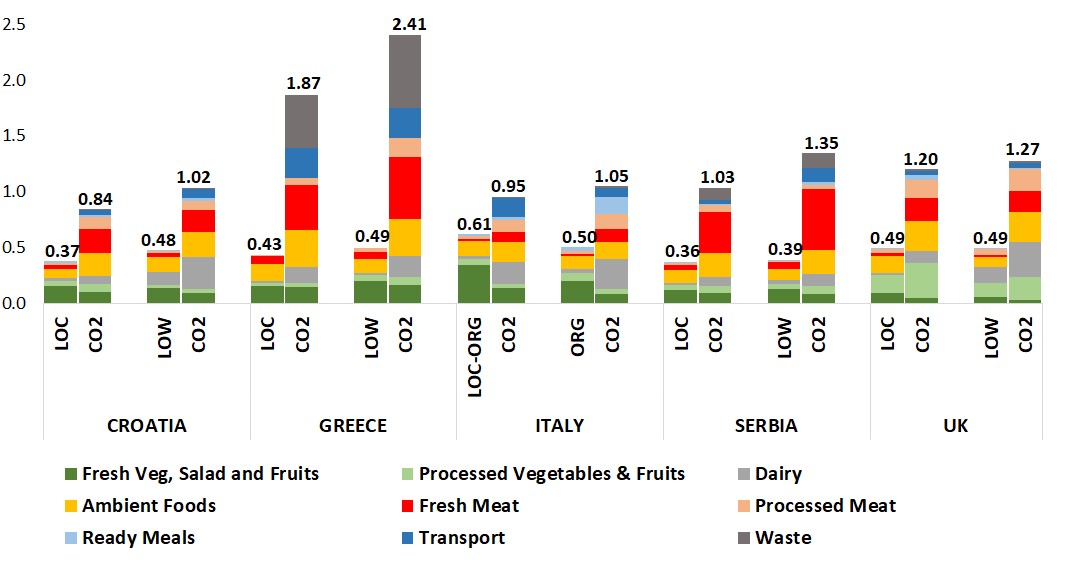
Within each pair, the left hand bar shows the weight (in kgs) of the food procured for an average meal in the service and its breakdown by food category, while the right hand bar shows the corresponding carbon emissions (in kgs C02e) for each food category.
The right hand bar also shows the emissions from downstream transportation of the foods (from wholesalers to canteens), and from the handling of the food waste.
Looking first at the weights of food procured for the average meal, considerable differences existed across the cases, from 0.36kg (Serbian LOC case), to 0.61kg (Italian Local-Organic case). Menu analysis confirmed that the Italian meals were indeed more elaborate, involving a first course, main dish with side, bread and fruit. Shorter, two course menus were typical in the other cases.
In terms of which foods were purchased for the average meals, the Italian meals were very healthy, with the highest proportions of fruits and vegetables (the vast majority of which were fresh) and only small amounts of meat. In contrast, the Greek and Serbian cases procured the highest proportions of meat for their meals, including relatively high quantities of red meat.
A striking result from a UK perspective was that the UK services procured the smallest proportions of fresh fruit and vegetables of all the cases. Examination of procurement invoices showed a heavy reliance on frozen vegetables, in particular.
Looking at the right hand bars in Figure 1, we can see the carbon emissions of the cases. Emissions from the Greek cases were by far the highest in the group, at more than four times the physical weight of the food purchased. The Serbian LOW case was the next highest, at more than three times the weight of food procured.
At the other end, the Croatian and Italian cases exhibited the lowest carbon emissions. Bearing in mind that that the Italian cases procured the largest quantities of food per average meal, the emissions of these two services were remarkably low, at only 1.5 and two times the weight of food procured.
So what was going on within the case services which explains those big differences in emissions? First is the disposal method of the plate waste. Looking at the Greek cases, food waste disposal (shown in dark grey) comprised around one third of the total emissions of both services, far greater than all the other cases. Why? All the food waste in the Greek services was sent to landfill, in contrast to the use of digesters, composters or animal feed in the other cases.
Second is the composition of the menus, in particular the amounts of red meat procured by the case services. The slightly higher proportions of meat procured for the Greek and Serbian menus, including red meat, translated into notably higher emissions in those cases - up to a half of total emissions in the Serbian cases (shown in red).
The conclusion is that to reduce carbon emissions, the priorities for catering managers should be switching to low carbon waste disposal methods, and adjusting amounts of red meat in menus.
And what about food miles? Importantly, downstream transportation was not found to contribute significantly to the total emissions of the case services, typically representing less than 10% of their total emissions. So, while 'going local' might bring certain economic or social advantages, and reduce some emissions at the margins, its impact on the total carbon footprint of a catering service is modest compared with other factors.
For more information, contact Angela Tregear, University of Edinburgh Business School: angela.tregear@ed.ac.uk